How we work

A peer-reviewed, dual-lens approach to climate and social vulnerability assessment

We combine geospatial environmental analysis with ground-level social network research to produce integrated vulnerability profiles. The methodology has been developed, tested, and published in peer-reviewed journals.

The architecture


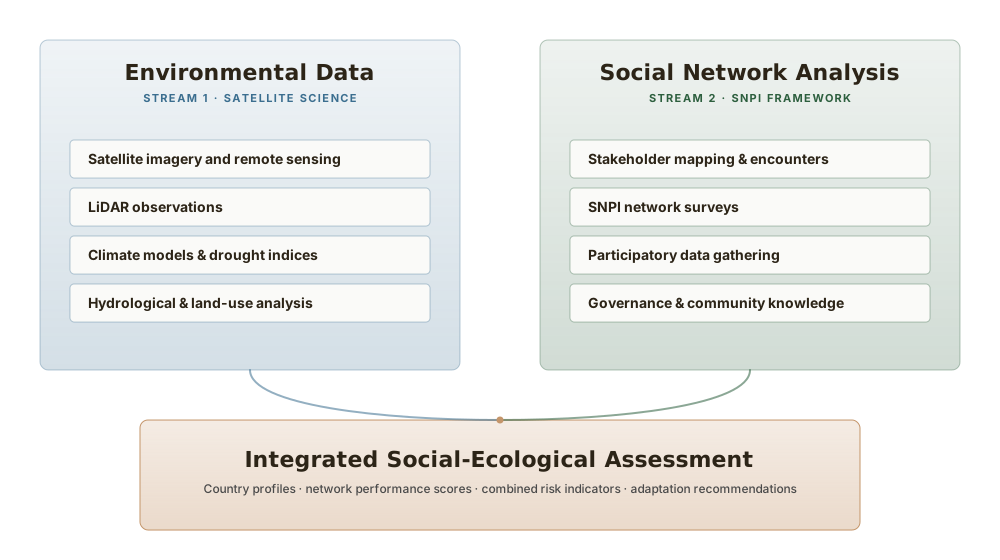
Two streams, one assessment

Social network analysis and environmental data are treated as co-equal analytical pillars. Both feed into a single integrated assessment, resolved to the unit of analysis set at the start of the engagement — down to the individual farm or parcel where the data supports it.

Social network analysis and environmental data are treated as co-equal analytical pillars. Both feed into a single integrated assessment, resolved to the unit of analysis set at the start of the engagement — down to the individual farm or parcel where the data supports it.

The method


Six phases, from first contact to integrated intelligence

Every engagement runs the same six phases. Five of them are constant. The fifth adapts to the domain — climate risk, wildlife and biodiversity, or urban nature-based solutions — which is what allows the same instrument to be applied across contexts without rebuilding it each time.

Stakeholder Discovery

Mapping the human landscape before the analysis begins

  • Desk research and document review to identify institutional actors — government bodies, NGOs, cooperatives, community organizations, and private sector entities in the target geography
  • Key informant interviews to surface actors invisible in formal records: informal community leaders, sub-national networks, cross-border relationships
  • Classification of actors by sector, scale, and functional role within the system
  • Initial relational mapping of known connections, collaborations, and information flows
Output

A validated node inventory with actor profiles, sector classifications, and preliminary relational data.

Boundary Setting & Matching

An analytical decision that shapes every subsequent phase — not a bureaucratic step

  • The spatial boundary — the administrative or ecological zone under assessment, from a watershed to a protected area buffer to a producing municipality
  • The actor boundary — which stakeholders fall in scope by functional relationship, regardless of administrative jurisdiction
  • Matching the two, so that the actor network and the geospatial analysis share one coherent and defensible unit of analysis
  • Setting analytical resolution, which can run from the individual farm or parcel up to national scale depending on the question and the available data
  • Documented rationale, including acknowledged limitations and edge cases, for methodological transparency and peer review readiness
Output

A boundary specification document and georeferenced study area that anchors every subsequent phase.

Stakeholder Encounters

Structured encounters that make collaboration visible — not consultations in the conventional sense

  • Multi-stakeholder workshops calibrated to the cultural, linguistic, and institutional context of each site
  • Participatory network elicitation — structured activities in which participants identify their own working relationships, information exchanges, and collaborations
  • Standardised survey instruments and facilitation protocols, ensuring comparability across sites and across time periods
  • Cross-sector dialogue in which government, civil society, private sector, and community surface shared challenges and identify collaborative pathways
Output

A site-level relational dataset capturing the direction, frequency, and quality of interactions between all identified actors.

Stakeholder Network Analysis with SNPI

Turning relational data into measurable governance intelligence, using a framework peer-reviewed in Environmental Science & Policy

  • Directed network graphs built from attribute-rich nodes and typed edges, visualised with organic spatial layouts that reveal structure without imposing hierarchy
  • SNPI metrics — network density, centrality distribution, reciprocity, clustering coefficients, bridging node identification, and tie strength profiles
  • Governance interpretation — fragmented clusters, isolated actors, over-centralised brokers, and the structural gaps that limit adaptive capacity
  • Longitudinal comparison where multi-year data exists, measuring change in network structure over time
Output

An SNPI indicator report with network visualisations, comparative metrics across sites, and interpretation of governance implications.

Domain analysis

The ecological counterpart to Phase 04 — the one phase that changes with context

  • Climate risk — hazard (drought, anomalous heat, flooding), vulnerability (census indicators, cadaster records, and the exposure of land and assets), and resilience, with scenario projections for 2030 and 2050
  • Wildlife and biodiversity — interaction pressure (species occupancy, encounter intensity, habitat connectivity) assessed against social tolerance at neighbourhood scale
  • Urban nature-based solutions — in development
Output

Georeferenced hazard and vulnerability layers, resolved to the unit of analysis established in Phase 02.

Social-Ecological Intelligence

Not a deliverable in the conventional sense, but a state — integrated, georeferenced, validated data held as a continuous resource

  • Site-level social-ecological profiles combining governance capacity with ecological stress and vulnerability
  • Strategic investment zones — where high hazard coincides with strong governance networks, and where institutional fragmentation has to be addressed before capital can deploy effectively
  • Evidence packages for monitoring, learning, and reporting: structured for funding renewals, programme evaluations, donor reporting, and internal governance reviews
  • A longitudinal intelligence architecture where multi-year monitoring is in place — a living dataset that compounds in value as new waves are collected
Output

Integrated social-ecological profiles by site, strategic investment maps, and evidence packages structured for programme teams that do not require specialist analytical capacity to use them.

Clients no longer have to choose between ecological data and social evidence. Both are integrated and calibrated to the same spatial and institutional boundary, so programme managers can answer the question their funders are actually asking — not just where the risk is, but who can respond, and what it will take.

Phase 05


Where the method adapts

Phases 01 to 04 and 06 run the same way in every engagement. Phase 05 is the module that changes — the ecological analysis matched to the question being asked. Because only this phase varies, a new application area is a new module rather than a new methodology, and the social measurement stays directly comparable across all of them.

In use

Climate risk

Hazard, vulnerability, and resilience — IPCC-aligned, extended with adaptive capacity

Downscaled climate data resolved to the farm rather than averaged across administrative zones, paired with a socioeconomic vulnerability picture built from census and cadaster records. Drought is analysed with STAND. Resilience is where this module meets the social stream: adaptive capacity is what the network analysis measures.

  • Drought modelled through soil moisture deficits, evapotranspiration rates, and seasonal precipitation anomalies, separating chronic from episodic water stress
  • Heat and anomalous temperature assessed alongside water deficit
  • Flooding estimated from precipitation intensity, hydraulic and remote sensing modelling, and soil saturation thresholds
  • Scenario projections aligned to IPCC pathways for 2030 and 2050
  • A combined vulnerability index weighting socioeconomic against biophysical factors at parcel level
  • Resilience read as adaptive capacity — the dimension where the SNPI network evidence enters the climate assessment
In use

Wildlife & biodiversity

Conflict-to-coexistence framework — interaction pressure assessed against social tolerance

Where people and wildlife share a landscape, persistence depends as much on tolerance and institutional capacity as on habitat. This module resolves both to the neighbourhood.

  • Encounter intensity modelled from species occupancy, detection frequency, and seasonal movement patterns
  • Conflict-prone interactions — property damage, road mortality, perceived risk — mapped as the drivers that erode tolerance
  • Habitat connectivity estimated from land cover, green-space network mapping, and movement-corridor modelling
  • Scenario projections of urbanisation and land-use change aligned to municipal development and green-infrastructure plans
  • Anchored in standardised monitoring data, including camera-trap occupancy records, wherever a partner already holds them
In development

Urban nature-based solutions

In development

A third module is being developed for urban nature-based solutions. It will run on the same five-phase spine, with Phase 05 addressing the ecological and social performance of urban nature-based interventions. Scope and indicators are not yet finalised.

Stream 1


Social Network Performance Indicators

The SNPI framework measures how well stakeholder networks actually collaborate on environmental governance. It links five key social indicators — relationship building, power sharing, social learning, trust building, and the potential for collective action — to quantitative network metrics such as density, centrality, and reciprocity.

Applied to a coffee sector governance network, SNPI produces a numerical picture of where collaboration is strong, where it fractures, and where external support could unlock collective action. It turns the social dimension into something measurable — not anecdotal.

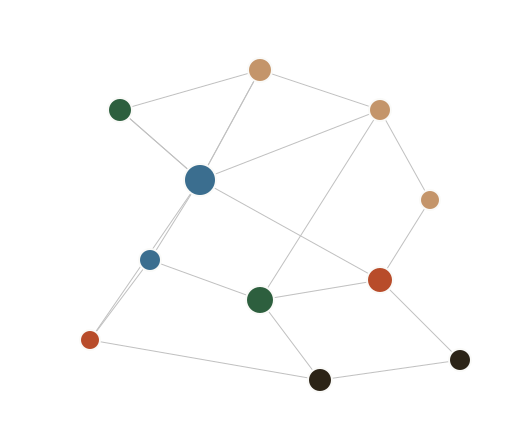
Sample network: five stakeholder categories drawn from the 2024 El Salvador study (illustrative).
  • Public institutions
  • Coffee business actors
  • Civil society & NGOs
  • Education & scientific
  • International organizations

Sample network: five stakeholder categories drawn from the 2024 El Salvador study (illustrative).

Data architecture


What makes SNPI more than a connection map

The network is built from two attribute-rich data types. That richness is what moves the analysis past basic connectivity and into governance interpretation — the difference between counting links and understanding what actually flows along them.

Nodes

Actors — people, organizations, institutions

Every node carries attributes, so the analysis can ask not only who is connected, but what kinds of actors hold central or peripheral positions.

Node attributes

  • Sector
  • Gender
  • Political jurisdiction
  • Professional role
  • Geographic location
  • Resource endowment
Edges

Typed relationships between actors

Edges are classified by what actually moves along them. This is how superficial coordination is distinguished from genuine collaborative infrastructure.

Edge types

  • Communication
  • Advice-seeking
  • Partnership
  • Resource transfer
  • Co-governance

Edge attributes

  • Tie strength — strong or weak
  • Directionality — who initiates
  • Flow type — information, funding, technical knowledge
  • Temporal stability
A network where resource-transfer edges cluster exclusively around a single central actor tells a very different resilience story than one where those flows are distributed.

What we calculate

  • Network density
  • Centrality distribution
  • Reciprocity
  • Clustering coefficients
  • Bridging node identification
  • Tie strength profiles

What we read from it

  • Fragmented clusters — sub-groups that do not exchange with one another
  • Isolated actors — participants with no functioning tie into the system
  • Over-centralised brokers — single points of failure in the flow of resources or information
  • Structural gaps — the missing connections that limit adaptive capacity

Stream 2


Environmental vulnerability analysis

Our environmental dimension is grounded in Dr. Vitali Diaz's peer-reviewed integrated climate-risk framework. Three interconnected components turn satellite data and hydrological science into decision-ready assessments of where coffee systems are most exposed — and why.

1. Climate characterisation and variability

We analyse precipitation and temperature using historical datasets and climate projections to identify patterns, trends, and potential future scenarios. The STRIVIng toolbox (Diaz et al., 2019) captures how conditions evolve and how variability affects coffee agroecosystems over time — both gradual shifts and extreme-event frequencies that drive yield and quality.

2. Drought characterisation and hydrological dynamics

Drought is analysed not only temporally but in its spatial dimension — estimating drought-affected areas simultaneously across territory, which is critical for agricultural planning at regional scale. Soil moisture, runoff, and infiltration are evaluated to link climate variability to real impacts on coffee production. Recent work (Diaz et al., 2026) applies this spatial drought-area approach to machine-learning crop-yield prediction, enabling data-driven early warning.

3. Integrated climate risk assessment

We assess risk across three components. Hazard — the intensity and frequency of drought, heat, and flood events. Vulnerability — land use, environmental conditions, and management practices, together with exposure: which land, assets, and populations sit in harm's way, read from census and cadaster records. And resilience — the capacity to absorb impacts and recover. Hazard and vulnerability follow the IPCC risk framing; resilience is the dimension we add, and it is where the social network evidence enters the assessment. Applied to the Lempa transboundary basin of the Central American Dry Corridor (Koshnazar et al., 2021) — the zone covering major coffee-producing areas in El Salvador, Guatemala, and Honduras — this produces a climate-risk index identifying where interventions matter most.

Agroforestry integration

Coffee across LAC relies on shade management, which regulates microclimate, improves soil structure, and enhances water infiltration. We integrate agroforestry variables into the hydrological analysis so we can compare alternative management scenarios — conservative management, intensified shade, or degradation pathways — and their implications for water regulation and long-term sustainability.

STAND · Drought analysis


STAND — drought as a moving object, not a monthly average

Most monitoring systems report drought as an index value over time. That gives severity but not shape — where an event begins, how far it spreads, which direction it travels, when it dissipates. Our environmental stream runs on STAND, the framework Dr. Vitali Díaz developed across a decade of peer-reviewed work and a TU Delft dissertation. STAND is an umbrella rather than a single procedure: several methods sit under it, and the seven steps below are the sequence they are usually run in.

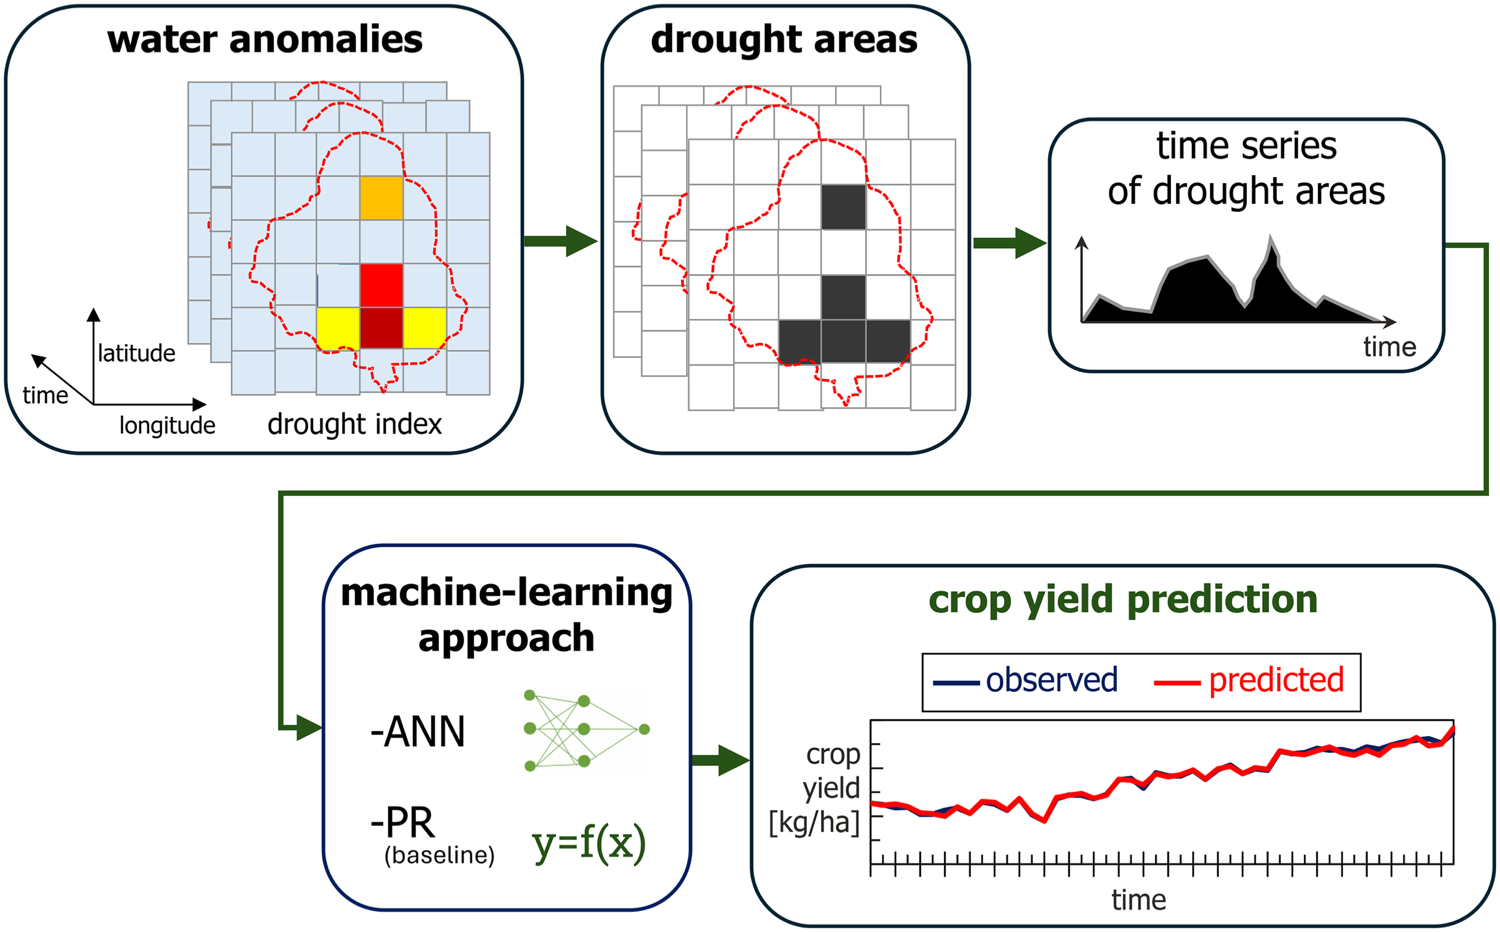
The drought analysis workflow: water anomalies become drought areas, drought areas become a time series, and that time series feeds machine-learning models that predict crop yield.
From water anomalies to yield prediction — the published workflow behind the drought stream.

Identify drought from hydrometeorological data

Precipitation and temperature from official station networks and satellite sources.

Calculate a drought indicator

A standardised index — typically the Standardized Precipitation Index — expressing water deficit in a way that is objective and comparable across places and periods.

Apply a threshold

A reference value separating normal conditions from drought, reducing the field to a binary state: in drought, or not.

Calculate drought areas

The Percentage of Drought Area quantifies how much of a region is in drought in each period — an intuitive measure of event intensity that a single index value cannot provide.

Trace the spatial trajectory

Contiguous drought areas are clustered at each time step and linked by their centroids, producing the path the drought actually travelled across the territory.

Analyse the event in three dimensions

Treating drought as a space-time object lets a single event be followed from onset to dissipation, and lets separate events be compared by extent, duration, and migration.

Predict impacts on crop yield

Physically-based and machine-learning models turn drought-area dynamics into seasonal yield prediction. Artificial neural networks consistently outperform the polynomial-regression baseline.

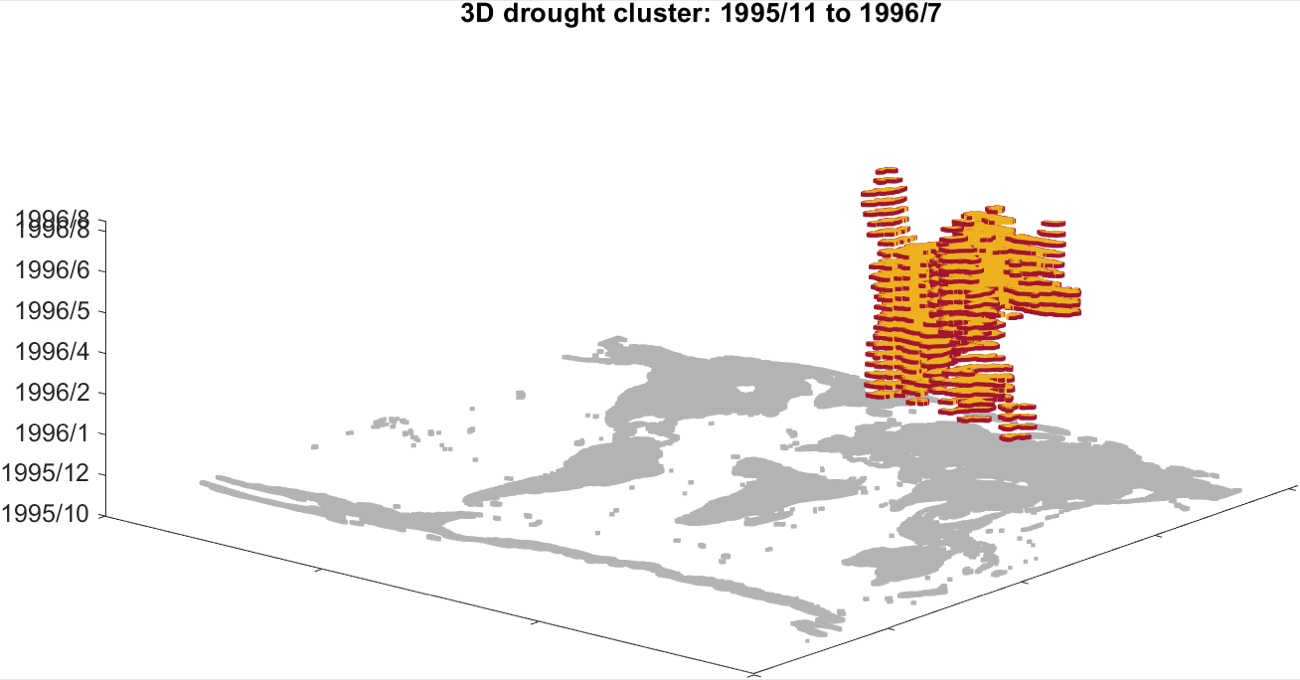
A three-dimensional drought cluster rendered over space and time, showing a single drought event from onset to dissipation.
A single drought event as a three-dimensional space-time object: the Pan-Eurasian drought of 1995–96.

Applied, not theoretical

The method has been run against the European Drought Monitor record, where it characterises historical events, compares their severity, and traces their movement. Three events it has been used to analyse:

  • Pan-Eurasian Extensive Drought — November 1995 to July 1996
  • Maritime Southeast Asia Long-Duration Drought — March 1997 to June 1998
  • Central Asian Migrating Drought — July 2011 to June 2012

Knowing that a drought was severe is not the same as knowing which districts it crossed, in what order, and how long it stayed. That is the difference between a number a ministry can file and a map a ministry can act on.

Integration


Bringing it together

The two streams are not merely juxtaposed — they are integrated. Environmental risk indicators are weighted by the social network's capacity to respond to them. A region facing high drought risk with a highly collaborative stakeholder network is in a fundamentally different position than one facing the same risk without that collaborative capacity. The integrated assessment captures both.

Our fieldwork methodology — stakeholder encounters, participatory data gathering, and co-designed research agendas — was developed and tested in El Salvador and published in 2024. It distinguishes between Scope 1 practice-oriented interventions (what stakeholders can do with existing capacity) and Scope 2 transformative interventions (what requires structural change). That distinction shapes the recommendations we produce for each country case study.

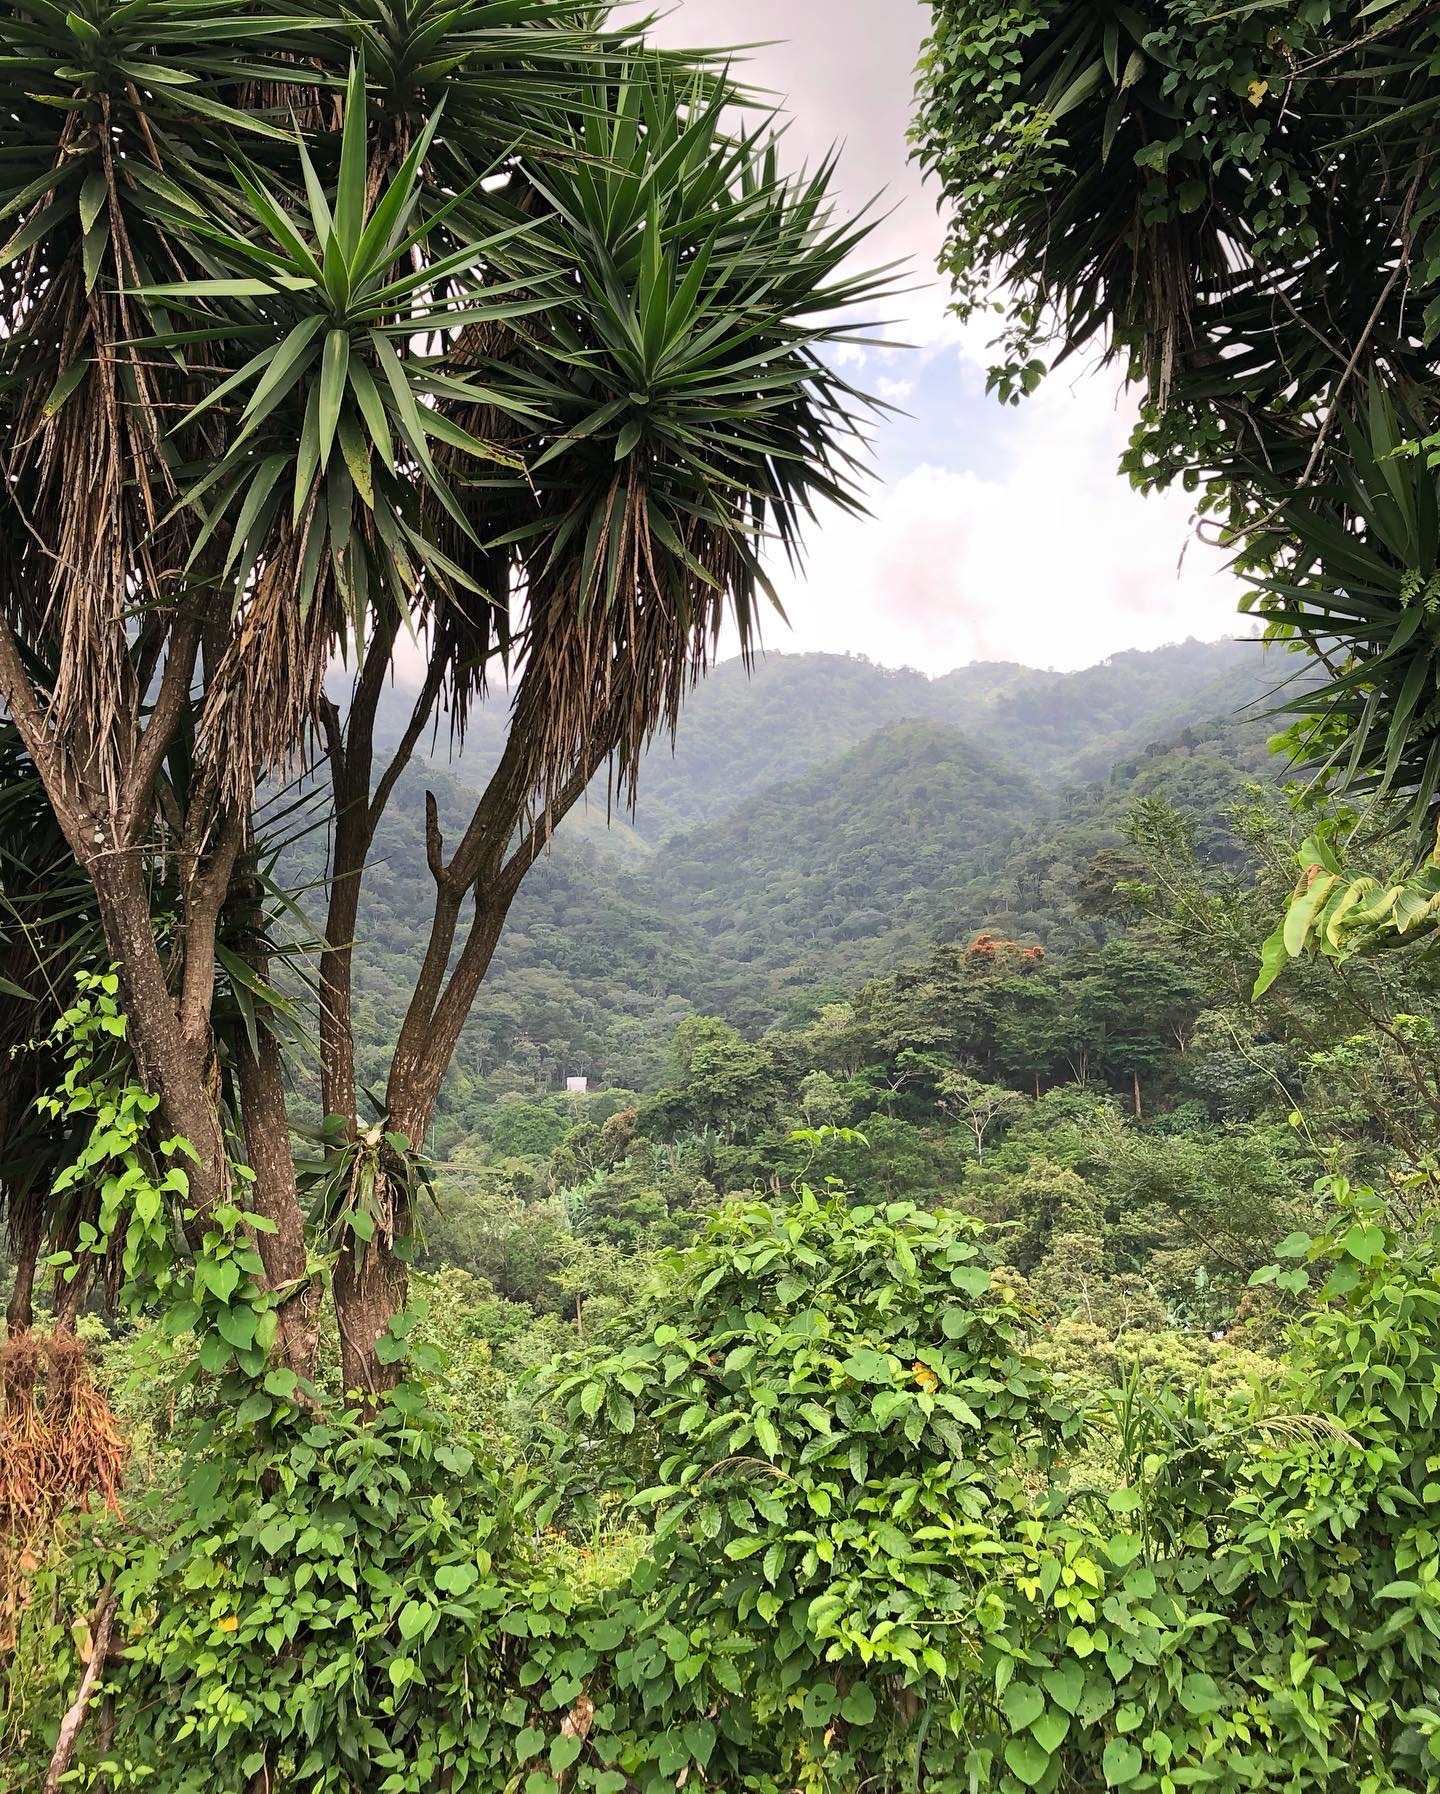
A Salvadoran coffee highland — misty mountain forest framed by palm trees — where the integrated methodology was first tested.

What integration produces


Strategic investment zones

Integrating the two streams answers a question neither can answer alone: not just where the pressure is, but whether anyone there is in a position to act on it. Cross the ecological reading from Phase 05 against the governance reading from Phase 04 and every site in a programme falls into one of four positions — each implying a different decision.

Strong network
Fragmented network
High pressure
High pressure · Strong network

Deploy now

Funding has somewhere to land. The institutions exist, they coordinate, and they can absorb and act on investment. This is the highest expected return per unit deployed, and the case for it is evidenced rather than asserted.

High pressure · Fragmented network

Repair coordination first

The need is real but the capacity to act on it is not. Capital deployed here underperforms until the structural gaps identified in Phase 04 are addressed — which is a finding funders rarely have before they commit, and the most expensive one to discover late.

Low pressure
Low pressure · Strong network

Hold and monitor

No immediate pressure, but a functioning network is itself an asset worth maintaining. Worth watching as scenario projections move the hazard picture, and worth protecting from the attrition that follows when programmes move on.

Low pressure · Fragmented network

Lowest priority

Neither urgency nor readiness. Revisit at the next monitoring wave rather than committing resources now — and note that this is the only quadrant where doing nothing is the defensible answer.

The vertical axis is read by whichever module occupies Phase 05: climate hazard against vulnerability in the climate risk edition, interaction pressure against social tolerance in the wildlife and biodiversity edition.

This is the argument for measuring before intervening. Two sites with identical hazard maps can warrant opposite decisions, and nothing in the ecological data alone will tell you which is which.

Standards & governance


Measurement institutions can audit

Independent evidence is only useful if it withstands scrutiny. Our methodology is aligned to a standard institutional clients already use, and the data behind it is governed under European law.

AA1000 Stakeholder Engagement Standard

Our engagement methodology aligns with AA1000SES, the most widely adopted stakeholder engagement standard globally. For an institutional client that matters practically: assurance and audit teams can read our process against principles they already work with — inclusivity, materiality, responsiveness, and impact — instead of evaluating a bespoke method from scratch.

Data governance under GDPR

We collect data about real people in real communities, so every engagement runs on a GDPR baseline: informed consent with a documented lawful basis, data minimisation, a Data Processing Agreement with the client as controller and Dialectik as processor, pseudonymisation wherever the analysis allows, and defined retention and secure erasure protocols.


The full methodology brief

Each edition is documented in a technical brief — the complete six-phase specification with figures, data architecture, and worked outputs. The briefs are shared directly with institutional partners and prospective clients rather than published openly, so tell us which application is relevant to your work and we will send the corresponding edition.

Request the methodology brief